

XYO/USDT Bullish Chart Analysis: Big Moves Could Be Coming
$XYO has caught the attention of many traders after a 108% gain last week, backed by strong trading volume. Here’s a simple breakdown of the chart and what it might mean for the future.
Recent Performance Last week’s price action showed impressive growth, but it’s important to stay cautious. Jumping in too quickly during high volatility can lead to unnecessary risks.
Key Levels to Watch
Entry Zone:
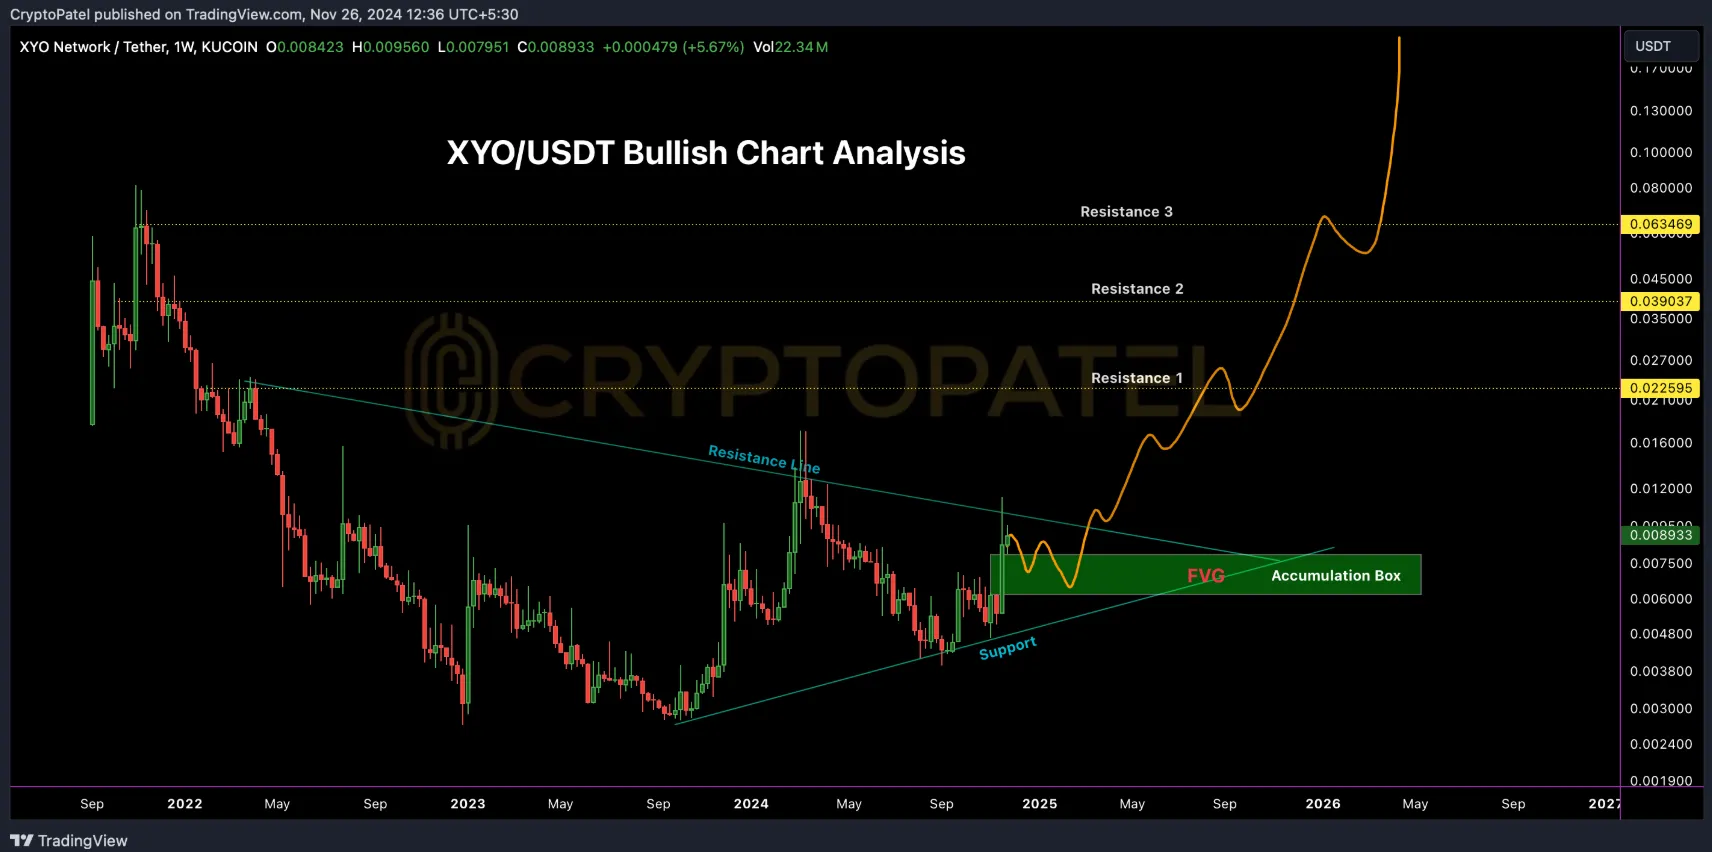
The best range to consider buying is between $0.0075 and $0.006, where prices may stabilize for a good opportunity.
Targets:
If the bullish momentum continues, potential target levels could be:
- $0.022
- $0.039
- $0.063
- ATH (All-Time High)
Stop Loss: To limit risks, set a stop loss at $0.005. This setup has both high risk and high reward potential.
Watch for a Breakout
The chart is forming a triangle pattern on higher timeframes. If the price breaks out of this triangle, it could lead to a strong move upward, making it easier to hit the target levels.
Tips for Safe Trading
The market can be unpredictable, so it’s best to avoid buying out of FOMO (Fear of Missing Out). Wait for the price to dip into the entry zone for a safer position. Always trade with proper risk management.
Final Thoughts
XYO shows a lot of potential, but patience is key. Waiting for a good entry point and watching for a triangle breakout could help you make the most of this opportunity. Don’t forget to use a stop loss to protect your investment.
Disclaimer: This analysis is for informational purposes only and is not financial advice. Always do your own research before making any trading decisions.
Stay updated for more simple and actionable insights.


